
Adobe vs Autodesk
Which of these two has the wider moat: a full math breakdown.

Both of these companies are dominant software giants: one is embedded in the daily workflows of artists, YouTubers and photographers (Adobe), while the other is embedded in the work of architects, constructors, engineers and 3D printer design artists.
Disclaimer: The author owns a position in Adobe.
Which one wins and why? Here is the brutal truth in Maths:
NabzdykRatings ’ verdict:
Adobe has an ROIC of 53.75%, which is driven by its NOPAT growth. Because it’s an evergreen business, it has a higher ROIC, as Adobe doesn’t need to put as much effort into selling the software. They have a stable WACC at 11.91%, with a spread having widened by 13.12%, driven by profits, although debt has moderated their ROIC.
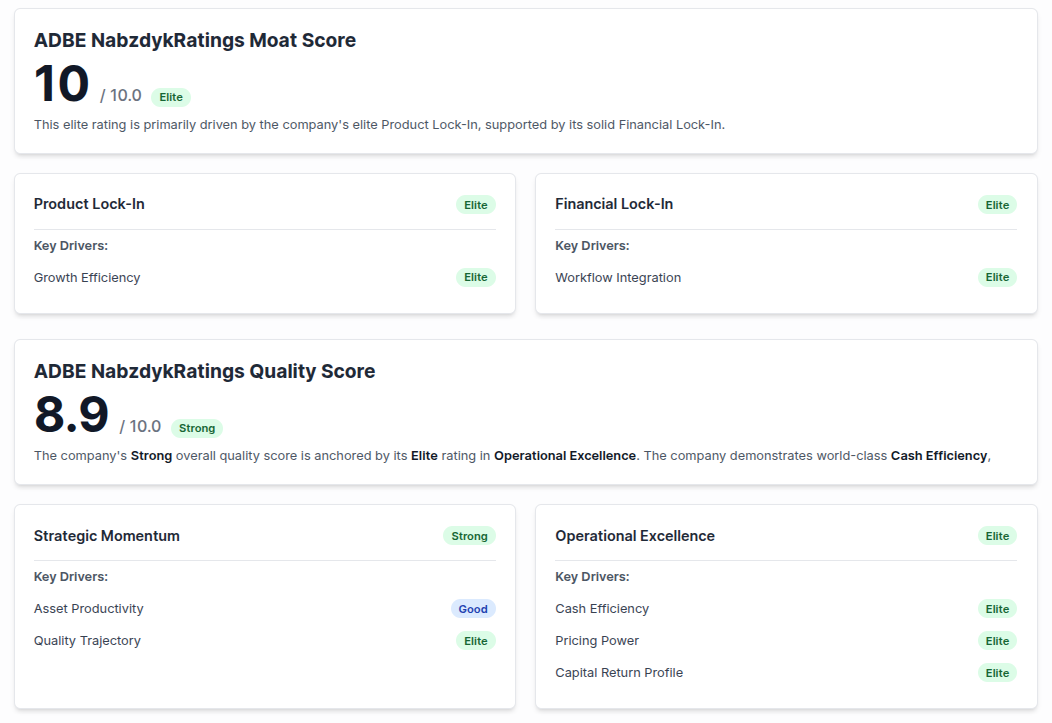
Adobe NabzdykRatings moat score: 10/10. Adobe NabzdykRatings Quality score: 8.9/10.
Autodesk has an ROIC of 29.74%, which is driven by its expansion of dbet and profits. It ahs a stbale WACC at 11.86%, wth a spread having widened by 1.46% - this company is running its busienss in a relatively stable way.
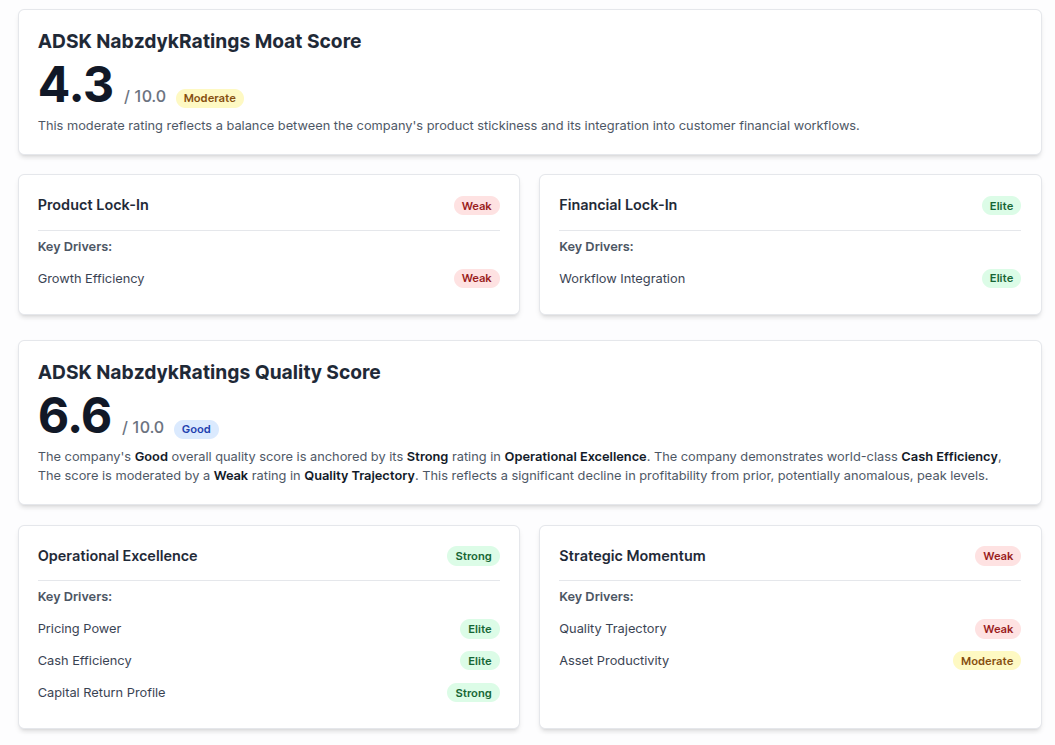
Autodesk NabzdykRatings moat score: 4.3/10. Autodesk NabzdykRatings Quality score: 6.6/10.
ROIC calculation for Autodesk:
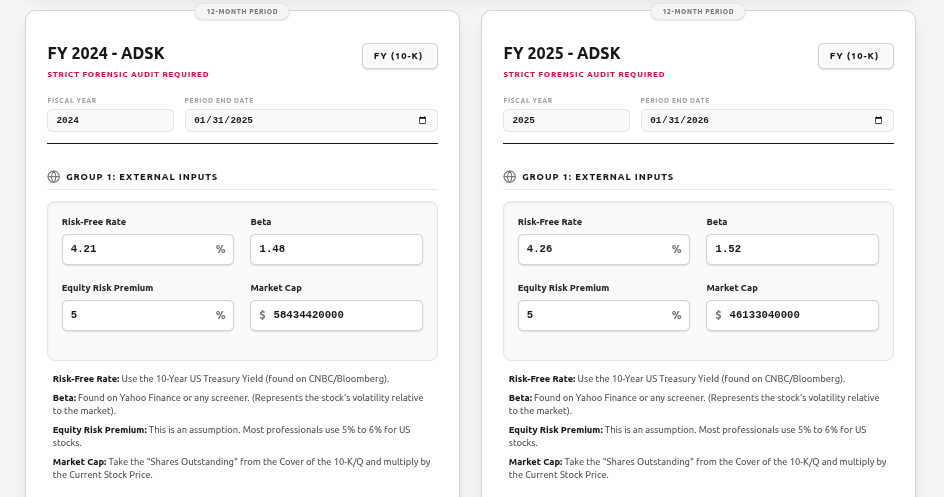
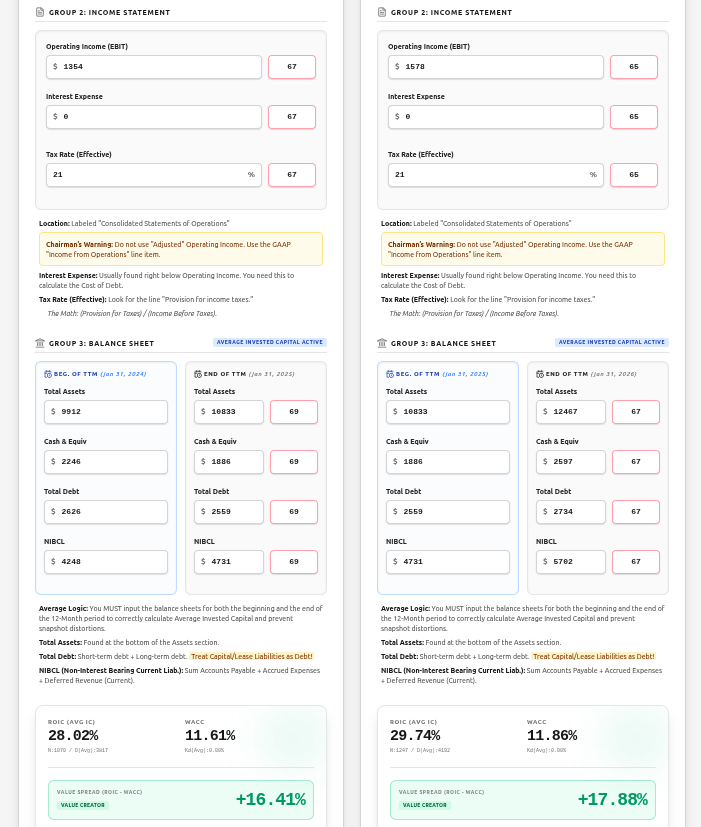
Autodesk WACC: 2024/2025: 11.61% / 11.86%
ROIC: 2024/2025: 28.02% / 29.74%
Spread – the difference between the two – this shows how well the actual business is going and whether it’s not losing money.
+16.41% vs +17.88%
means we have a deepening moat – the spread widened by 1.46%.
Disclaimer: the 21% tax rate comes because of a negative tax percentage – that would render the ROIC calculation useless, so it had to be taken to a standard tax rate for corporations.
For Adobe:
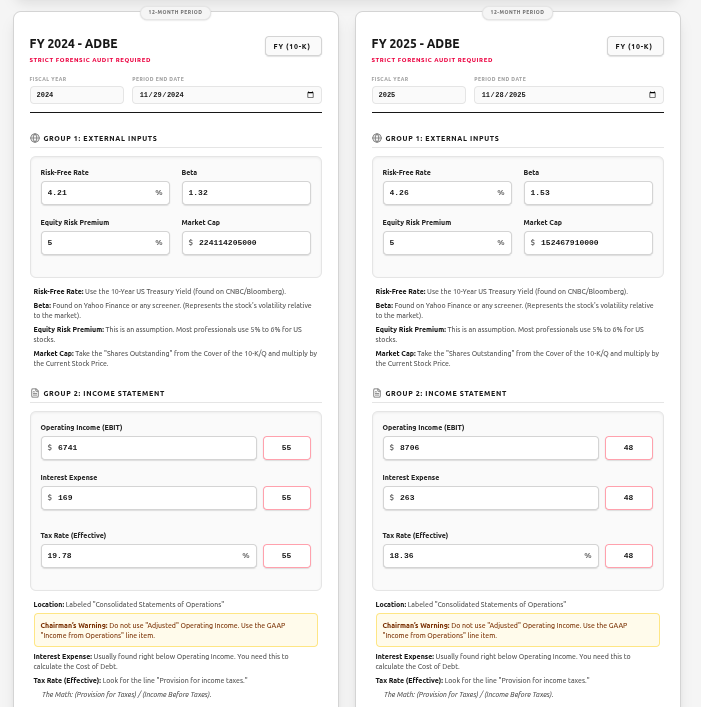
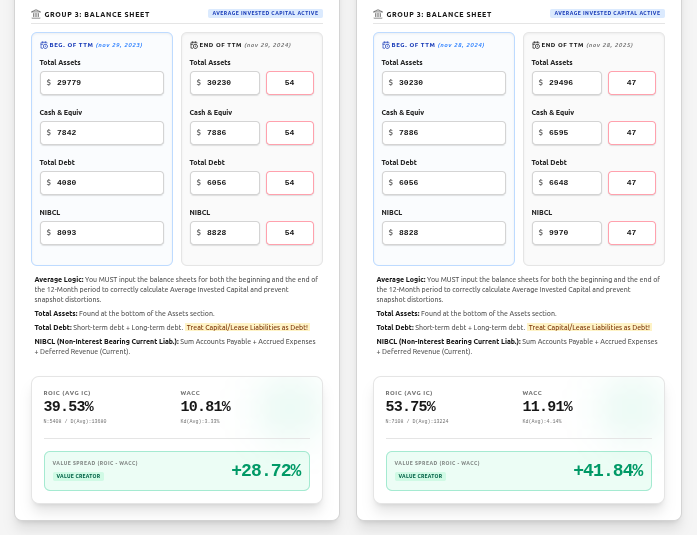
Adobe ROIC: 2024/2025: 39.53%/53.75%
WACC: 2024/2025: 10.81%/11.91%
Spread: +28.72% / +41.84% - Deepening Moat - Spread widened by 13.12%.
Why is that so? Well, consider the fact that Adobe is growing its SBC (stock-based compensation) at 5.61%, while its FCF is growing at 20.08%.
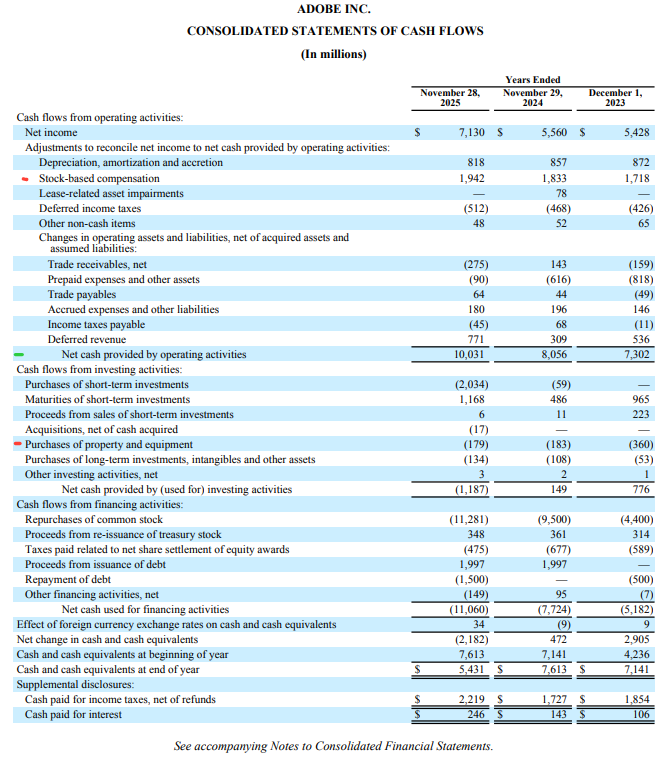
CFO and purchases of property, plant and equipment are what make up FCF: CFO - PPE.
SBC as a % of FCF in 2024/2025: 28.28% / 19.71% – so we can see it’s under the 20% mark that we find optimal.
Comparing that to Autodesk (2026 and 2025 selected, because of calendar/fiscal year comparison needed):
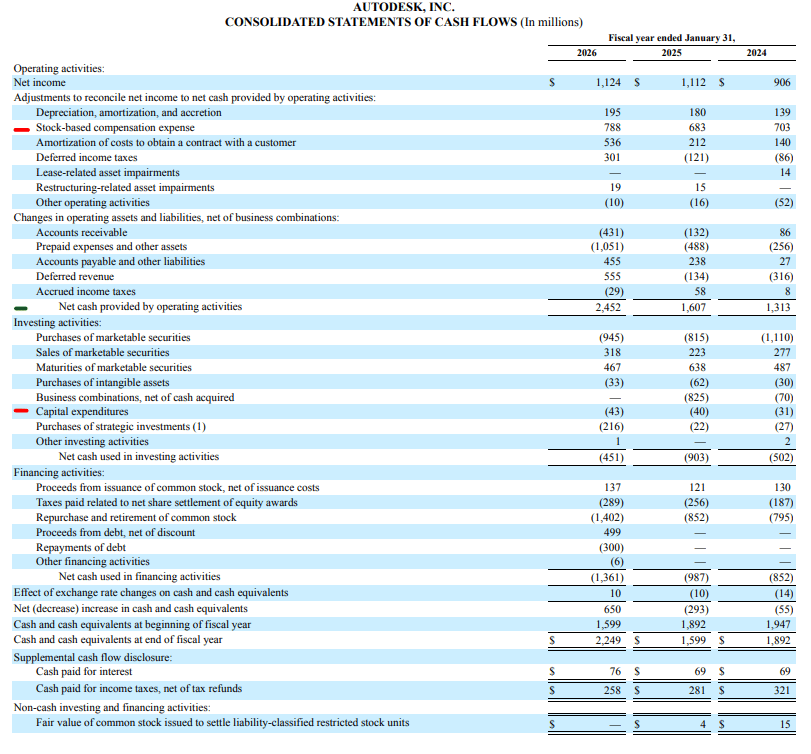
Whose SBC is growing at 13.32%, and FCF is growing at 39.95% (2024/2025 – changed from 2025/2026 to match Adobe – more apples-to-apples comparison)
SBC as a % of FCF is 43.58% / 32.71% – so we can see it’s declining, but it’s still bad.
But even so, now that we know these components, why is the difference so visible? Well, it has to do with the industries they are serving:
Architects are needed all the time, but in times of higher interest rates, building slows down, as it’s more expensive to borrow money.
Artists & photographers are not affected by these changes as much; hence, we have a striking difference.
This isn’t financial advice.