


Gartner.


Click. You enter the meeting room. You are presenting a strategy to the board of directors about where to direct the business to. In order to get the most trustworthy research on your competitor’s, you reached out for a product called Magic Quadrant, which makes it easier to compare data on a simple scale. What’s even better, is that you’ve used the same company to look up whether it’s a good idea to make those big investments right now in order to beat your competitors.
The room turns silent. Slowly, you present the statistics to your colleagues. They are impressed. And then you think to yourself, just what is the company behind this? The answer is no other than Gartner. But should you invest your $100 into it, to buy a fractional share of it, instead of those latest JBL headphones? I think Mr Krabs might have done just that, but was he right, or not, let’s find out! :) This article is made with my friend,
view:Approach
At My Weekly Stock, we blend in-depth market analysis with proven momentum-based trading strategies. I have developed a proprietary momentum approach that I use to analyze stocks, which relies on three key components:
1. Performance: I like to see stocks trading within 5% of their 1-year high, which indicates strong momentum and minimal resistance. Winning stocks also typically perform better than their peers across multiple timeframes.
2. Trend: I use the 9 and 21 (or 30) exponential moving averages (EMAs) on the daily and weekly charts to assess the trend’s strength. Strong trends typically involve the 9-week EMA being above the 30-week EMA, the stock trading above both EMAs and rising trend lines. I score each stock’s chart out of 5, with a score above 3 suggesting a solid trend.
3. Key Levels: Support and resistance levels are critical technical analysis components, serving as indicators for potential market reversals or continuations. My preferred method is to look for previous highs and lows, any levels where the trend has historically changed, and price gaps.
This approach involves identifying stocks with strong positive momentum and riding their upward trend for as long as possible. While timing the market to perfection is not my goal—since catching the exact highs and lows is more a matter of luck than skill—my experience and research have proven that there is significant profit to be made in the core of a move.
Gartner Momentum Analysis
1. Performance
Gartner is flat in the past month, down 7% in the last quarter, and up 14% over the last year. The stock is trading 12% below its 1-year high, a sizeable drawdown and suggesting some overhead resistance. Its performance has been overall mixed and mostly lagging behind its sector, industry, and peers.

I used the following benchmarks:
$CTSH (Cognizant Technology Solutions Corp)
$EPAM (EPAM Systems Inc)
$XLK (Technology Select Sector SPDR ETF)
$IGV (iShares Expanded Tech-Software Sector ETF)
Analysis was based on the price at the close on Tuesday, February 18th, 2025.
2. Trend
Weekly chart: Solid
The broader long-term trend remains solid. The recent pullback has brought the price back to the 9-week EMA, a natural trendline support in a bull run. We are clearly in a cooldown phase, and the next few weeks will be key. A bounce from this level would be the healthier scenario, preventing the recent softness from evolving into a more significant correction.

Daily chart: Weak
The daily chart confirms bearish short-term momentum, with the recent break below the 21-day EMA signaling a loss of strength. The last earnings report sparked a rally to $584, but the stock faced strong rejection and retraced all the post-earnings gains—and more. It’s too early to determine whether this short-term weakness is over, and buyers will need to step in to prevent further downside.
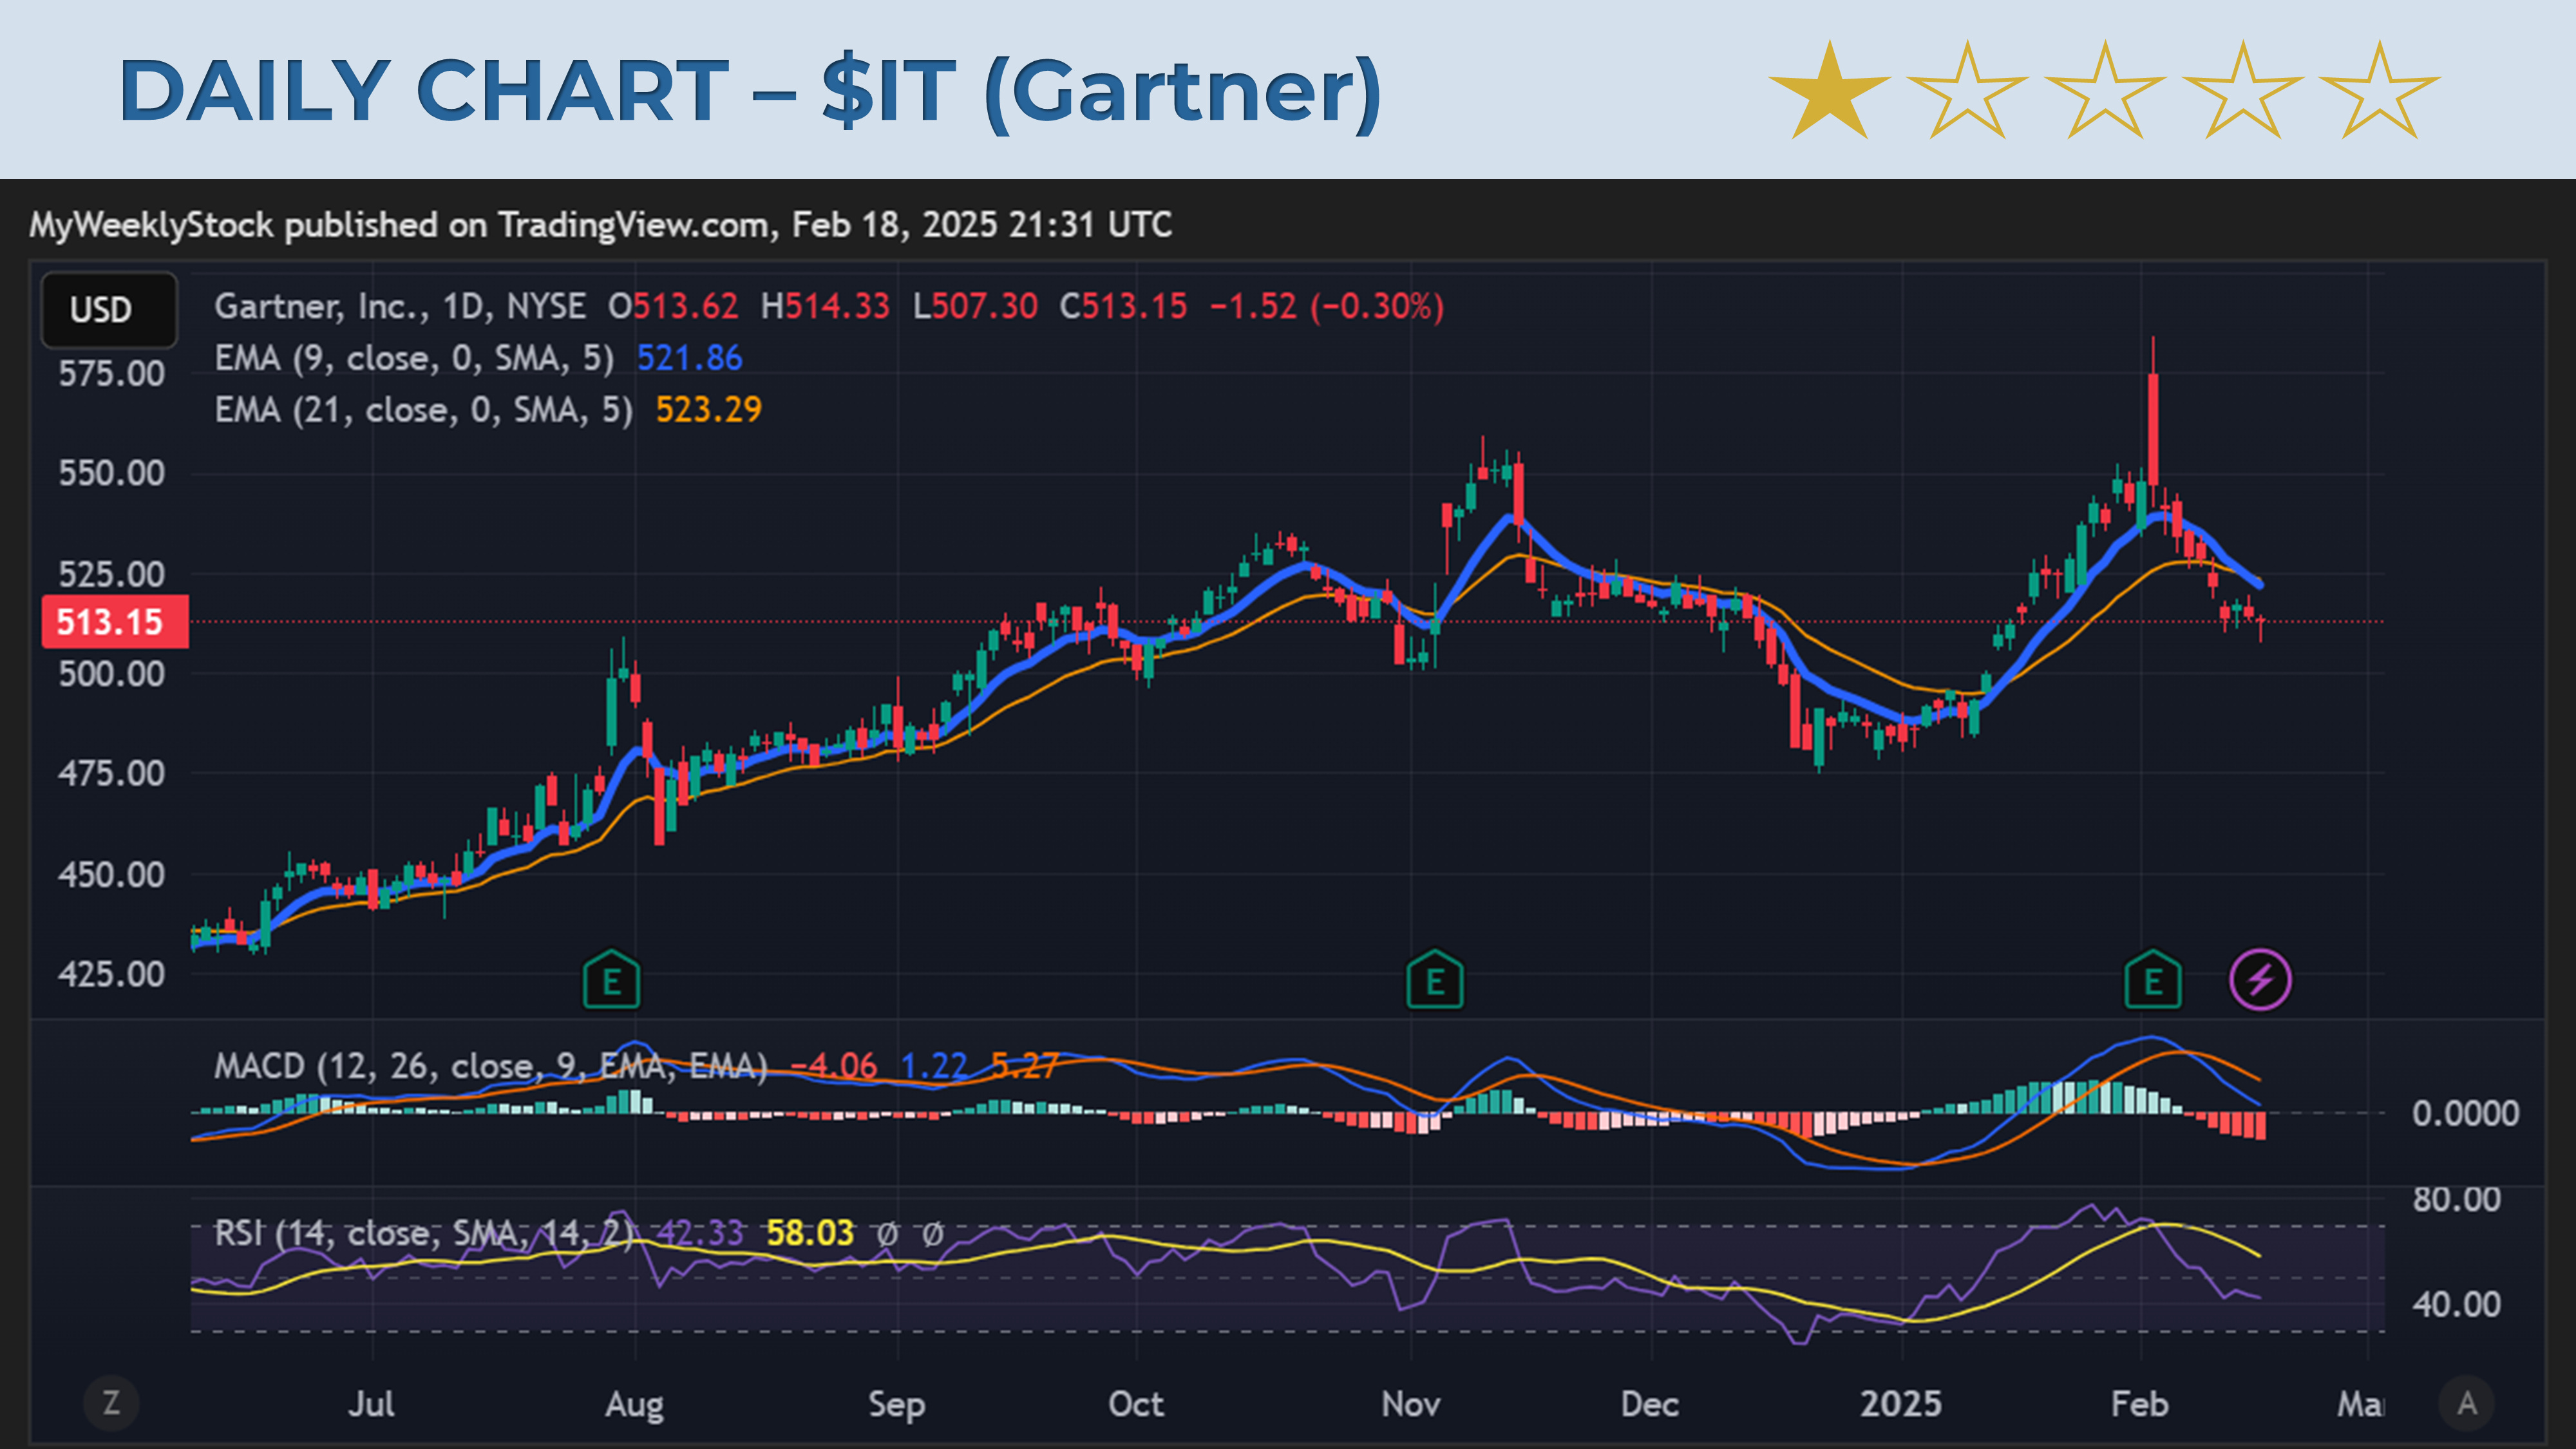
3. Key Levels (and % vs. current price)
Support:
$500 (-3%)
$475 (-7%)
Resistance:
$550 (+7%)
$584 (+14%)
The $475 level is a critical support zone, marking the Dec–Jan swing low. A break below this level would likely signal further downside pressure. On the upside, $550 is the first significant resistance, where the stock struggled during the November rally. A breakout above $550 would strengthen the recovery case, but $584 remains the key hurdle longer term.
My View: PASS – Short-Term Weakness Keeps Me Cautious
Gartner remains in a broader uptrend, but short-term weakness is evident. The recent softness was driven by the failure to hold on post-earnings gains after reaching $584, marking the third consecutive earnings-driven rally that quickly faded. Ideally, buyers defend $500, with $475 as a critical support level that I hope we don’t revisit at all.
We are clearly in a cooldown phase, and it’s too early to tell whether this is just a healthy pullback or the start of a deeper correction. Gartner is a pass for me at the moment, though if I were a long-term holder, I’d likely hold here and watch (hope?) for buyers to step in soon.
My view:
Stock Information
Einstein said that if you can’t explain something to a 9-year old child, you don’t understand it yourself. Let’s try explaining what Gartner is to a 9-year old child.
School, 2PM, You collect your 9-year old son at the end of the school day, it’s Spring, birds are chirping
S: Hi Dad! How are you?
Y: Hey Tom! I’m good. Let’s go home. How was school?
S: Oh, you know… the usual.
Y: Well, I was thinking… I always tell you I’m a business advisor, but that doesn’t really explain what I do, right?
S: Yeah, I guess. So what do you actually do?
Y: Okay, imagine this: You know how sometimes Grandma struggles to turn on the TV? She keeps pressing the wrong button, and you have to show her how to do it?
S: Yeah, all the time!
Y: Well, my job is kind of like that, but instead of helping Grandma, I help big companies that are struggling with old technology. Some of them still use really ancient software…
S: Like Windows 95?
Y: (Laughing) Exactly! So they come to us because they know we can help them upgrade to better, faster, and cheaper technology. Kind of like giving Grandma a smart remote so she doesn’t get confused.
S: Okay, that makes sense. But what does that have to do with saving money?
Y: Good question! Think about a classroom full of kids running wild. If there’s no teacher, it’s chaos. But if you get an experienced teacher, they can handle the class, right?
S: Yeah, of course!
Y: Now, experienced teachers cost more, right? But what if we gave them really good tools—like an app that helps track behavior or an online system that makes grading super fast? That way, they can do their job better without needing extra help. That’s what we do for companies: we teach them how to use technology to work smarter, not harder.
S: So you help businesses run better by teaching them about tech?
Y: Exactly! And the other big part of my job is writing reports—kind of like your school assignments. We compare different technologies and companies to see which ones work best, then we share that knowledge so businesses can make smart decisions.
S: That sounds cool… except for the reports. That part sounds boring.
Y: (Sighs) Yeah… sometimes it is.
(Car honking! ZOOM!)
Y: Hey! That guy drives like a rotten apple!
S: (Grinning) Dad, you just said you teach people to be smart and competitive. But you're losing to that driver right now!
Y: (Laughs) You got me there. Maybe I need more rest... or maybe I should write a report on bad drivers!
The end.
Hahaha! That’s what Gartner does - teach companies how to use their resources effectively, and make their operations even better! I hope you understand it now! :)
If you still don’t, here’s what they do:
They teach businesses to earn more money by implementing technology in the right way, checking if it’s worth investing into certain things right now and be prepared for any changes in industry by reading their reports. GET IT?
Still not?
C’mon! :)
Their market share is as follows (made using my special tool, I programmed myself, and will be available soon: https://market-share-chart.sketchthread.com/ ):
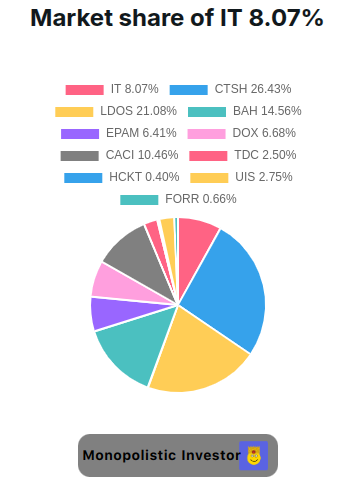
It has a smaller percentage than the Cognizant of 26.43%, but we also need to look at their product offerings that they have:

They are all made only by them, so we have the moat of big data, as they have expertise in analysing it, and that’s what makes a great moat - data you can’t get easily on companies’ competitive advantages, for example.
1. Hype Cycle™ – Is This Just a Fad or the Future?
Tech trends rise and fall faster than meme stocks. One day, everyone’s hyped about blockchain; the next, they’ve moved on to AI-generated pizza. Gartner’s Hype Cycle™ helps separate real innovations from overhyped buzzwords. It shows you where a technology stands—whether it’s at the “Peak of Inflated Expectations” (hello, Metaverse) or entering the “Plateau of Productivity” (think cloud computing).
Companies that are their customers and may use this: Amazon
2. Magic Quadrant™ – Who’s Leading the Tech Race?
Think of this as the Champions League for tech vendors. Gartner ranks companies into four categories:
Leaders – The best of the best. Dominating the market.
Challengers – Strong players but not as innovative.
Visionaries – Full of great ideas but still finding their way.
Niche Players – Specialists, but not industry giants.
If you’re investing or choosing a vendor, this chart tells you who’s worth your money.
Companies that are their customers and may use this: Google and Microsoft
3. Critical Capabilities – Not Just Flashy Logos, But Real Performance
The Magic Quadrant tells you who’s winning, but Critical Capabilities tells you why. This is the deep dive—ranking vendors based on actual product features, scalability, security, and usability. If the Magic Quadrant™ is a race, this is the stat sheet on each competitor.
Companies that are their customers and may use this: Salesforce and Apple
4. Digital IQ – Are You Falling Behind?
Ever wonder how your company stacks up against the competition? Digital IQ benchmarks your business’s tech maturity against industry peers. If your competitors are using AI-powered automation while you’re still stuck with spreadsheets, this tool tells you—politely—that it’s time to step up.
Companies that are their customers and may use this: Amazon and Apple
5. Product Decisions – What Do Buyers Actually Want?
Let’s say you’re building a new SaaS product. What features should you prioritize? Product Decisions uses Gartner’s proprietary buyer data to tell you exactly that—helping you build a product roadmap that actually meets demand.
Companies that are their customers and may use this: Apple and Google
6. BuySmart™ – Don’t Waste Money on Useless Tech
Bad tech purchases can cost millions (remember when companies invested in Second Life?). BuySmart™ helps businesses evaluate vendors, avoid common mistakes, and get the best deals on technology.
Companies that are their customers and may use this: Meta and IBM
Ok, so now we have a little bit of knowledge on their company, but what about the efficiency of it? We don’t want a company, which is losing money. We want companies with high ROIC metrics, as well as Return on Equity (The original capital returns), and the return on assets - pretty self explanantory (How much returns do they get from things that make money in their business):
I made a VSO chart using my tool I programmed all by myself:

We can see that IT has some great ratings, being above the median in all three categories, but we have another company called BAH (A company involved in business analytics as well, but it doesn’t have that many famous products - which can have margin expansion more easily, as customers see the value in the brand). Think Coca-Cola - who doesn’t drink it?

We can see that every $100, they make $118.
We’ll also take a look at their profit margins, as we want companies with high gross margins, so we have room for margin expansion. or in other words, WE WANT the company to make us more bucks later on, get it?

Let’s see: A gross margin of 67.72% (What they keep after the direct sales of the product), operating margin is at 18%, and profit margin at 20.00%, so we have some room for margin expansion! :)
Financial health
One of the most important aspects of investing - never buy a company that has more debt than assets, unless you are really confident in it, and have a valid reason to do so. So, let’s see whether Gratner is a strong company, or just your regular "minecraft Chicken with a zombie” or in other words - something you can dismiss as not dangerous, but really is - THEY ARE SO Fast in Minecraft. The greatest horror of minecraft players:


Shareholder’s equity is positive, so I like that, but they have a net cash position, so I guess that the net cash position which is on the minus side is a bigger problem. But other than that, they have a 2.13 Debt to Equity ratio or in other words “The amount of time it would take them to pay off their debt from their net earnings”, so 2.13 years. Not bad, I guess it’s ok, but we should target companies with D/E below 1 ideally. But now let’s move on to Revenue growth:
Revenue growth
We want predictable companies, with growing free cash flow, and revenue growth that is sustainable. IS Gartner this kind of company, or is it a Doofenshmirtz-styled company?


We can clearly see the trend over here. A company with its revenues growing year over year, and what’s even more important, is the net income growth that they have, because they can use that money to grow their business even more. SO it’s predictable! :)
Valuation
I don’t understand people who flock to buy the latest clothes on a black friday week, yet when stock prices drop, they don’t do the same. I’m the opposite, and so should you. This can pose a great opportunity for us investors. That’s why I made a tool that provides a short valuation of a company. Here it is:

A realistic / conservative scenario, considering their revenue growth is around the range of 6-8%.
Conclusion
Am I buying this company? No, even though they possess a wide moat, and great financials, with a stable revenue position, I’m not too bullish on them, as they aren’t the biggest company doing a similar job, but they do have a presence. A better company to look at would be maybe FICO, but that’s for another article!
This isn’t financial advice.
A waitlist for your future market share tool, do consider clicking this (Or not):
And for premium members, my financial health prediction video for Gartner:
Financial health prediction:
 | A guest post by
|