Click. You take out your iPhone from your backpack. It works really fast. Everything seamlessly connects to each other. Airdrop files from your iPads, Macs and IPhones. Apple One subscription as well as Apple TV, Icloud, Music. An App Store full of stories. And that’s all in one company, possibly the greatest monopoly of all time: Apple. But is this company what it used to be or is it a slow growing cash burning monster?
Let’s find out. :)
In collaboration with DIY Investor:
https://substack.com/@diyinvestor1
Stock Information
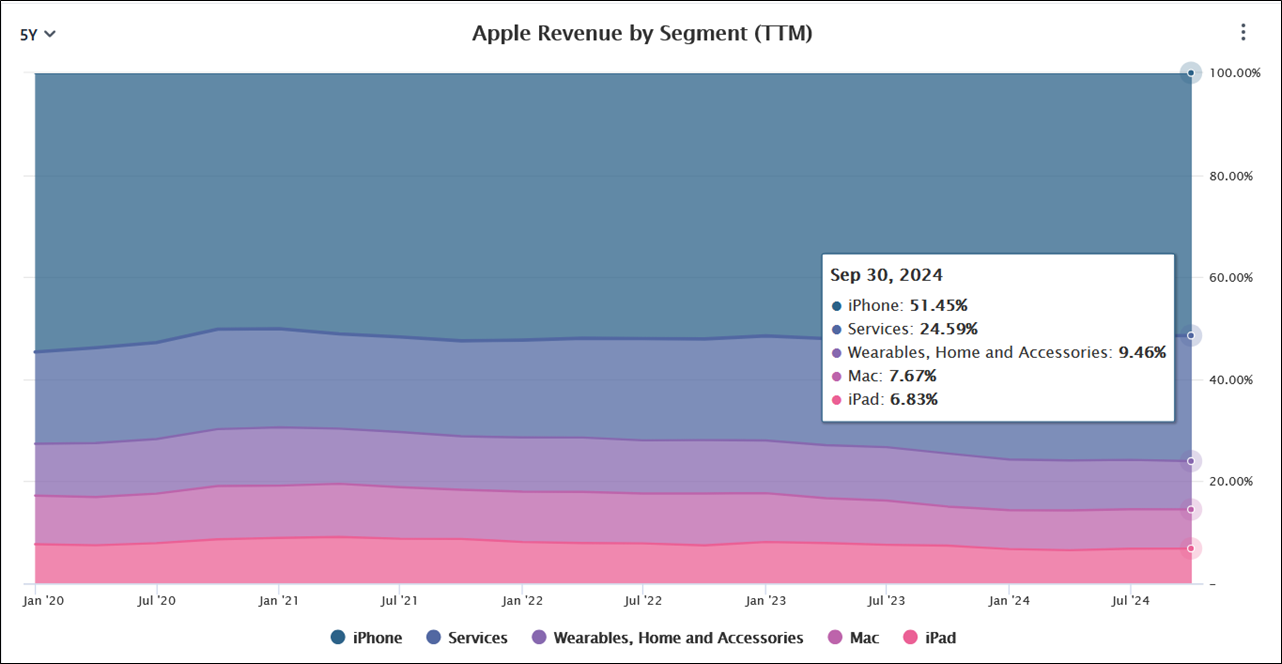
If you’ve been living under a rock, you can’t have heard about Apple owning many products:
It’s more than a technology company by now. It’s a service company. The subscriptions they offer are long-term cash flows into the company. They basically want you to stay in their ecosystem forever. Pretty wide moat, don’t you think so?
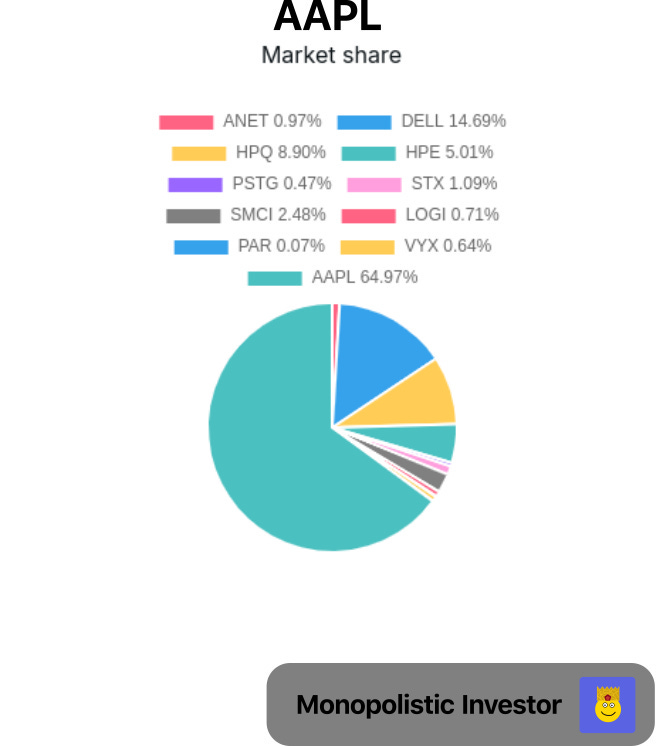
But let’s not guess here, WHAT IS their market share? Let’s use my tool to find out (I’m a programmer):
Ok, that’s superb! Some of the companies might not be the direct competitors, but they are close enough, and we put them in anyway.
How hard is your money working for you? If you invest in a company, you want to make sure that the money you put into it isn’t laying around in a sock. You want your coins to be your greatest employees. That’s why we need to take a look at their financial efficiency comparison (It’s as if you wanted to measure whether buying that FIFA player was good for your team or not, depending on the number of goals he scored). For that, we look at three metrics: ROIC, ROA and ROE.
ROIC is what the outside capital is doing,
ROA is how much the company appreciates by,
ROE is the money originally put into the company, and the return on it.
Financial efficiency VSO (Versus others) chart (also my tool):
and you can see the areas that are better than the median (light green and dark green), as well as worse (yellow, light red and dark red). We can see AAPL has their three metrics in the dark green, showing us a great financially efficient company compared to their peers, but check out LOGI and ANET - must be also great companies! It’s a great method to check out companies with a more efficient business model than that of their peers, as the numbers clearly show how much money is flowing back into the company.
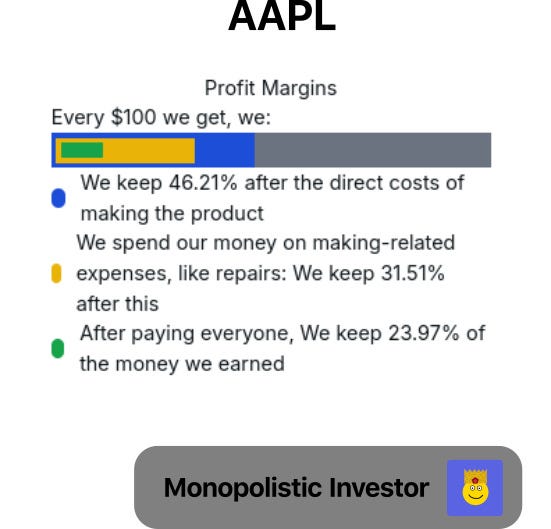
Profit margins:
Ok, pretty solid!The blue section is the gross margin, so the direct cost of making the product, yellow is their operating one and green is what the company receives after everything gets paid. And that’s the metric which is the most important to us. We want this metric to be as high as possible, as that would mean that the value perceived by the customers is much higher than that of what they have to pay.
Financial Health
If you don’t look at the financial health of a business, you’ll end up like us - eaten for lunch… Or?
Probably a Chicken quote
AAPL financial health cubes are made out of 125 blocks, each cube being proportionally divided, so that it reflects the real proportions between the values, red mean negative values, and green positive.
A revolutionary way to show financial health of companies (made by me):
Net cash on the minus side! I don’t like that! Their net equity is positive, but keep in mind their high level of debt!
Their Debt to EBITDA ratio (Number of years to pay off their debt completely from their earnings before the interests on their money, taxes, debt repayments and amortisation transactions happening) is sitting at 0.79, so it wouldn’t take them even a year before they would pay off all their debt, which is nice to see, apart from their minus net cash position.
If you have any ideas on how to show complicated stock metrics easily, let me know, and I’ll try to create it! :]
Alright, let’s move on!
Revenue growth
We can clearly see that Apple has really strong quarters, in which they have tremendous revenue boosts (new IPhone mania), followed by times of no growth. Not the best, as it shows you a picture of a stalwart, as Peter Lynch would say. Not good Apple, not good. But it’s similar to Amazon with that one quarter, as Amazon has their Prime Day, during which you have many promotions and such.
Its revenue growth YOY, based on TTM, is basically on the 0% mark, one time being 2%, but for the most time, negative or no growth at all.
Their net income dropped a significant amount last quarter, which is surprising.
Dividends & Buybacks
They have a Dividend Yield of 0.41%, with 4.21% growth, as well as a buyback Yield
of 2.56%.
I mean, that’s not the best dividend growth, but it’s better than nothing. That’s the only metric, apart from their financial health and revenue, that I don’t like. Payout ratio is at 16%, so no tragedy there, but a bit disappointed.
Valuation
Simplywall.st:
Mine (using the tool I made, with a 7% revenue growth rate):
Keep in mind those are only estimates! I could make mistakes, but over time, my tool should have fewer of them! :)
Conclusion
Apple has a dominant market position, there’s no doubt on that, and they’re a great company to put your money into, just not right now, as they have a valuation which exceeds that of the S&P 500.They would need to come down to $180, for me to start thinking about buying, as right now, they are at price levels which I don’t consider undervalued, accounting for the PE ratio. Better opportunities elsewhere.
Another laugh:
My old article (It’s so funny in hindsight):
Not financial advice.
🛠️📊💡 DIY Investor Says: 💸📈🔧
📝 Overview:
Apple Inc., founded in 1976 by Steve Jobs, Steve Wozniak, and Ronald Wayne, is one of the world’s most valuable and influential technology companies. Known for its iconic products like the iPhone, Mac, iPad, and Apple Watch, Apple has a strong reputation for innovation, design, and creating an ecosystem that seamlessly integrates hardware, software, and services.
💼 Business Model:
Apple generates revenue from multiple streams:
📱 Products:
iPhone (core revenue driver)
Mac, iPad, and wearables (Apple Watch, AirPods)
🛠️ Services:
App Store, iCloud, Apple Music, Apple TV+, Apple Pay, and more
Services revenue has been a growing segment, improving Apple's margins and providing recurring income
📊 Regional Revenue:
🌎 Only 43% of revenue comes from the Americas (US, Canada, and Latin America).
🛡️ Competitive Advantages (Moats):
1️⃣ Brand Loyalty: Apple’s brand is synonymous with quality, design, and innovation.
2️⃣ Ecosystem: Seamless integration between devices and services keeps customers within its ecosystem.
3️⃣ Pricing Power: Customers are willing to pay a premium for Apple products, boosting profitability.
📈 Financial Highlights:
💰 Market Cap: ~$3.7 trillion.
🏦 Return on Invested Capital (ROIC): Consistently delivers high ROIC (~22%), showcasing its efficiency in generating profits.💡 Investment Wisdom:
CAGR (Compound Annual Growth Rate) of a company’s stock price usually matches its ROIC. For instance, Apple’s average ROIC is 22%, while its CAGR is 21%. This reflects how a business growing in value is mirrored in its stock performance.💵 Cash Flow: Strong free cash flow generation supports buybacks and dividends.
🌟 Why It’s a High-Quality Business:
Apple exemplifies a high ROIC business with a wide moat and a conservative balance sheet. Its strong brand and ecosystem make it resilient to competitive pressures. The company is led by a skilled management team that has consistently delivered results.
📉 Apple’s revenue and earnings growth have slowed down significantly, yet the stock keeps 📈 marching higher.
🚀 It has returned 32% in 2024 alone! 💰
🍏 Apple is a high-quality business that almost never misses even quarterly estimates, let alone annual ones, as can be seen below. Its recent performance highlights the predictability of its business model rather than showcasing analysts' forecasting prowess.

✨ Peak Valuation:
Interestingly, Apple achieved its peak valuation in 2003, with a forward P/E ratio of 86—reflecting exceptionally high expectations of future growth. At the time, this valuation was arguably justified given the transformative innovation Apple was introducing, particularly with the iPod’s success and the impending launch of groundbreaking products.📉 Dramatic Shift by 2012:
By 2012, Apple’s forward P/E ratio had dropped dramatically to 8.8, signaling a shift in market perception. Despite this steep decline in valuation metrics, Apple continued to perform strongly, further showcasing the predictability of its business model.🔍 The drop in P/E wasn’t a reflection of weakening fundamentals but rather the market adjusting its growth expectations for a mature, highly profitable company.

⚠️ Risks:
📉 Dependence on iPhone: A significant portion of revenue still comes from the iPhone.
🌍 Global Supply Chain: Exposed to geopolitical tensions and disruptions.
📊 Market Saturation: Growth may slow in mature markets where Apple already has a strong presence.
💡 Valuation Check:
Apple trades at a premium valuation, reflecting its quality but not growth prospects.
👉 TLDR; Recent Valuation Analysis:
If you believe a company growing 40% slower than Microsoft should trade at 33 PE, then Apple is a buy below $244.
If you think it should trade at 24 PE (its 20-year average), then it’s a buy below $177.
I’m in the latter camp of believers. 🧠
📊 More Detail:
🍏 Apple’s Historical Valuation
Apple has been valued at around 24 P/E by the market (📘 blue line, Normal P/E) for the last 20 years, including peaks and troughs, as shown below. During this time, the company grew 33% annually.

📈 Future Projections (Based on 24 P/E):
If we use 24 P/E with 8.8% EPS growth for the next 5 years, the expected annual return is 1% (typed this up with a straight face 😐).

🤔 What if we tweak the valuation?
If we ignore trough valuations between 2010–2020ish, Apple would trade around 33 P/E. Using that, the expected return over the next 5 years is 6.5%.

Feeling generous? If we assume 38 P/E (or you're a big Apple fanboy 😅), the return over the next 5 years would be 9%.
📈 Bonus: If Apple surprises to the upside (like the ~10% EPS surprises post-pandemic), your total return could be 9.9% instead of 9%.

👀 What are the Superinvestors doing?
Below, you can see that Superinvestors are mostly dumping the stock. Notably, Buffett dumped 25% of his Apple holdings in the last quarter. He may have other reasons, such as expectations of higher tax rates or risk management for Berkshire Hathaway.💭 My Take:
So, what is it? 🤷♂️ I don’t own any of it—never did (a mistake, obviously). I’d like to wait for a better entry point, possibly around 24 P/E, which is its historical valuation.

If you you have come down all the way down here, then you must smash the Subscribe button now. Your screen will freeze until you do.
Disclaimer: This is for educational purposes only and might be fantastic or terrible financial advice for you—I have no clue, as I’m not your financial advisor.


